CORE FITNESS SCORE
VDOT-style running calculator.
This free VDOT-style calculator uses the Daniels–Gilbert equations associated with Jack Daniels’ running method. Enter a recent race distance and time to get a CORE Fitness Score, equivalent race times and easy, marathon, threshold, interval and repetition pace ranges. Copy your results or print a pace chart. It models performance, not laboratory VO₂max.
Your race result
Race conditions (optional)
These inputs create a declared sensitivity scenario. They do not measure your “true fitness.”
Training pace ranges
Use a recent representative race. These bands organize training; the session and your recovery decide the effort.
Daniels–Gilbert performance model. Training bands are model ranges, not a laboratory VO₂max measurement.
| Session | Per mile | Per km | 400m |
|---|---|---|---|
| Easy | 7:54–9:28/mi | 4:54–5:53/km | 1:58–2:21 |
| Marathon | 7:13–7:22/mi | 4:29–4:35/km | 1:48–1:50 |
| Threshold | 6:52–7:00/mi | 4:16–4:21/km | 1:42–1:44 |
| Interval | 6:11–6:21/mi | 3:51–3:57/km | 1:32–1:35 |
| Repetition | 5:44–5:57/mi | 3:34–3:42/km | 1:25–1:29 |
Your score needs a story
A race equivalent is a comparison, not a promise.
A fast 5K can suggest marathon potential. It cannot tell you whether your long-run preparation, fueling or durability will carry it to the finish.
Two runners have the same 5K time. Must they run the same marathon time?Think it through, then reveal the explanation
No. The model gives them the same equivalent, but their marathon preparation and race conditions can differ. Compare a recent longer race before treating the equivalent as a target.
Race equivalence reality check
A fast 5K and a slower-than-equivalent half marathon do not identify a diagnosis. First compare dates and conditions; then inspect sustained training and pacing. Do not raise training pace simply to match the shorter-race score.
Use this in your next training review
- Record two recent races: distance, time, date, terrain and weather.
- Compare both races in the VDOT calculator. Which equivalent performances agree, and which diverge?
- Write one explanation to investigate: endurance, pacing, conditions or an outdated result. What evidence would distinguish them?
Free, no email required. Source links and space for your notes included.
Put it into practice. Use the two-race comparison to see where your recent performances agree—and where a prediction needs more context.
VDOT reference calculatorTAKE IT TO TRAINING
Your track split sheet.
Choose the distance written in your session. These are timing references; your plan sets the repetitions and recovery.
| Session | Split range | How to use it |
|---|---|---|
| Easy | 1:58–2:21 | Comfortable running. Keep conversation easy; use effort when the pace does not fit the day. |
| Marathon | 1:48–1:50 | A marathon-effort reference. Race preparation and long-run durability still determine a realistic goal. |
| Threshold | 1:42–1:44 | Controlled, sustained work. The training plan sets the duration and recovery. |
| Interval | 1:32–1:35 | Hard aerobic work. A split alone does not tell you how many repetitions to run. |
| Repetition | 1:25–1:29 | Short, relaxed speed. Recovery and good form matter more than chasing a number. |
How to use each pace range
- Easy
- Comfortable running. Keep conversation easy; use effort when the pace does not fit the day.
- Marathon
- A marathon-effort reference. Race preparation and long-run durability still determine a realistic goal.
- Threshold
- Controlled, sustained work. The training plan sets the duration and recovery.
- Interval
- Hard aerobic work. A split alone does not tell you how many repetitions to run.
- Repetition
- Short, relaxed speed. Recovery and good form matter more than chasing a number.
What does my 5K time mean for training?
Start with a recent race, not the time you hope to run. These examples use the same equations as the calculator above. Open your nearest result to change the inputs and see every training pace.
| 5K result | Score | Easy / mile | Easy / km | Marathon equivalent |
|---|---|---|---|---|
| 18:00 | 56.3 | 7:09–8:35/mi | 4:27–5:20/km | 2:52:25 |
| 20:00 | 49.8 | 7:54–9:28/mi | 4:54–5:53/km | 3:11:17 |
| 22:00 | 44.5 | 8:38–10:21/mi | 5:22–6:26/km | 3:30:03 |
| 25:00 | 38.3 | 9:44–11:38/mi | 6:03–7:14/km | 3:57:55 |
| 30:00 | 30.8 | 11:33–13:44/mi | 7:11–8:32/km | 4:43:39 |
| 35:00 | 25.6 | 13:20–15:46/mi | 8:17–9:48/km | 5:28:30 |
Why the marathon column is not a race prediction
A 5K establishes one performance over a short distance. The marathon equivalent assumes you can sustain the model’s corresponding demand for much longer. It does not measure your long-run preparation, fueling tolerance or ability to hold form late. Compare a recent half marathon and your training evidence before choosing a marathon goal.
When the easy pace does not feel easy
Use comfortable conversation as a practical check, and slow down when the listed pace does not fit the day. Heat, hills and fatigue can change the effort. Do not turn the faster end of a range into a target you must hit. Explore heat and humidity separately, or read how to use each training pace.
This is an independent implementation, not the official V.O2 calculator or a measured VO₂max test. Compare the official V.O2 calculator and training explanations. The table stays fixed when you change your inputs; your personal results update above.
VDOT-style score and race-time reference chart
Computed with the same Daniels–Gilbert equations as this calculator. Equivalent performances compare aerobic demand; they do not promise a race result. Enter your own race above for your pace ranges.
| Score | 5K | 10K | Half marathon | Marathon |
|---|---|---|---|---|
| 30 | 30:41 | 1:03:49 | 2:21:17 | 4:49:49 |
| 35 | 26:59 | 56:02 | 2:04:13 | 4:16:06 |
| 40 | 24:06 | 50:01 | 1:50:54 | 3:49:37 |
| 45 | 21:49 | 45:13 | 1:40:14 | 3:28:16 |
| 50 | 19:56 | 41:20 | 1:31:31 | 3:10:40 |
| 55 | 18:22 | 38:06 | 1:24:16 | 2:55:55 |
| 60 | 17:03 | 35:22 | 1:18:09 | 2:43:22 |
| 65 | 15:55 | 33:02 | 1:12:54 | 2:32:35 |
| 70 | 14:56 | 31:01 | 1:08:23 | 2:23:13 |
Do your race results tell the same story?
Compare the race above with another actual result. A short race can suggest a marathon equivalent without showing that you are ready to run it.
Enter a second result to compare. Both races must be between 1500m and the marathon.
This difference is not a diagnosis or a new target pace. Race dates, effort, conditions, fueling and preparation can all explain it. Compare similar conditions and discuss the gap with your coach.
Calculated in this browser. The second result is not saved or added to the share link.
See how your score is calculated
- Race velocity (m/min)
- 250.00
- Modeled oxygen cost
- 47.46
- Modeled sustainable fraction
- 0.9530
- Cost ÷ fraction = performance score
- 49.81
The score uses Daniels–Gilbert equations. Our training ranges are independently calculated: Easy 59–74%, Threshold 86–88%, Interval 97–100%, Repetition 105–110% of the score’s modeled oxygen demand; Marathon is the equivalent pace ±1%. These are not the licensed V.O2 pace tables. Fractions above 100% are mathematical short-duration inputs, not measured physiology.
V.O2 · Official calculatorEquivalent performances.
These compare modeled aerobic performance. The 50K and 100K values are extrapolations; terrain and endurance dominate.
| Distance | Time | Context |
|---|---|---|
| 1.5 km | 5:25 | Physiological equivalent |
| 1 mile | 5:51 | Physiological equivalent |
| 3 km | 11:35 | Physiological equivalent |
| 5 km | 20:00 | Physiological equivalent |
| 10 km | 41:28 | Physiological equivalent |
| 15 km | 1:03:46 | Physiological equivalent |
| 10 miles | 1:08:45 | Physiological equivalent |
| Half marathon | 1:31:50 | Physiological equivalent |
| 25 km | 1:50:05 | Physiological equivalent |
| 30 km | 2:13:38 | Physiological equivalent |
| Marathon | 3:11:17 | Physiological equivalent |
| 50 km | 3:48:04 | Ultra extrapolation — endurance and terrain dominate |
| 100 km | 7:40:36 | Ultra extrapolation — endurance and terrain dominate |
Your progress.
Add dated race results to compare your own performance. Stored on this device; no account needed.
Add two dated results to see a trend.
| Date | Distance | Time | Score |
|---|
Boston qualifying gap
Use your actual marathon result. A short-race equivalent does not establish qualification.
Enter race-day age to compare the 2027 standard.
| Measure | Value |
|---|
Course terrain scenario
Select a course to compare its sourced elevation profile with the flat reference.
This energy-cost model omits downhill muscle damage, aid stops and your training durability. It is a scenario, not a predicted finish time.
Paces in these conditions
The current score stays fixed. The entered weather and altitude apply a declared sensitivity range; this is not a confidence interval.
| Session | Per mile | Per km |
|---|
A course adjustment needs verified elevation and conditions. Read the strategy before adopting a generic time penalty.
Build a Boston strategyFIELD NOTES · 28 SECONDS
A race result. A useful range.
A short visual explanation before you work through the details.
Use the number as a starting point. The full method and its limits are below.
Calculator methods and limitationsRead the transcript
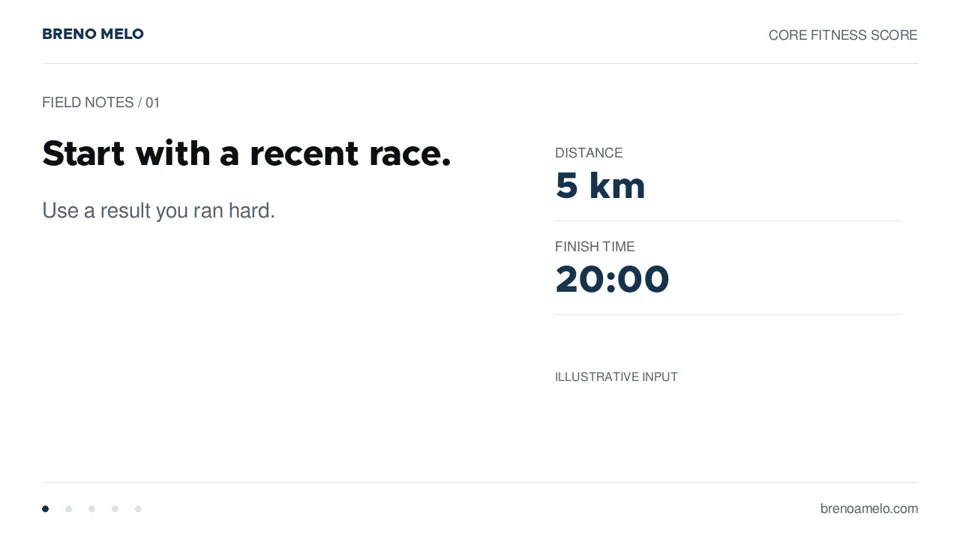
Start with a recent race you ran hard. Enter its distance and finish time. CORE Fitness Score uses the Daniels and Gilbert equations to estimate fitness, equivalent race times. These are estimates, not promises. Long distance predictions depend on endurance training. Use the suggested range and adjust for conditions and how the session feels.
 Watch the field note Close the video
Why this number?
This free VDOT-style calculator uses the Daniels–Gilbert equations associated with Jack Daniels’ running method. Enter a recent race distance and time to get a CORE Fitness Score, equivalent race times and easy, marathon, threshold, interval and repetition pace ranges. Copy your results or print a pace chart. It models performance, not laboratory VO₂max.
Score = (−4.6 + 0.182258v + 0.000104v²) / [0.8 + 0.1894393e^(−0.012778t) + 0.2989558e^(−0.1932605t)], where velocity v is m/min and t is minutes. Daniels–Gilbert equations. Pace bands are stated intensity scenarios.
How do I use it?
Use an actual recent race, then select a standard distance or enter custom miles or kilometers.
The score is unit-independent. Pace tables include both systems; optional conditions use °F/feet or °C/meters. Compare equivalent times with your endurance preparation.
- Enter recent, representative values.
- Choose units and check the assumptions.
- Review the result and its context.
- Copy, share or print the output.
Public inputs are encoded in share links. Check what you are sharing.
Questions, answered.
How does CORE Fitness Score compare with VDOT?
It uses the Daniels–Gilbert performance equations and explicitly stated intensity bands. It is an independently implemented running tool, not the licensed V.O2 calculator. Repetition bands and conditions scenarios may differ; read the methodology before comparing outputs.
How do I calculate a VDOT-style score from a 5K?
Choose 5K and enter your recent finish time in minutes:seconds. A 20:00 5K gives a CORE Fitness Score of about 49.8 with the Daniels–Gilbert equations. The calculator also shows equivalent race times and training pace ranges. A marathon equivalent assumes endurance your 5K cannot establish.
Can I print a VDOT-style pace chart without an email?
Yes. Choose Print / save PDF for your current results, or download a marathon pace-band PDF. No email is required. The chart uses this tool’s equations and stated intensity bands; it is not a scan of the official Daniels tables.
Is this my measured VO₂max?
No. It is a performance score calculated from a race. A metabolic test measures something different.
Should I train at my goal score?
Use a recent representative race. A goal time is a plan, not evidence of current fitness.
Can a 5K predict my marathon?
It can calculate a physiological equivalent. It cannot know whether you have developed the endurance, fueling and durability for that marathon.
How do conditions change the score?
Optional conditions generate a declared sensitivity scenario. It cannot reconstruct your true fitness from temperature alone.
Can I compare races over time?
Add dated results to the local trend. Scores are only comparable when race effort, conditions and training context are considered.
UNDERSTAND THE RESULT
Read the coaching context.
Use these guides to understand the assumptions and apply the result to your training.